Categories
Guide

Effect Of COVID19 On eCommerce In The USA – Statistics & Infographic

COVID19 had a big impact on the world economy in both good and bad ways. The eCommerce industry saw a drastic rise in online sales and many online stores actually made more than expected during the pandemic.

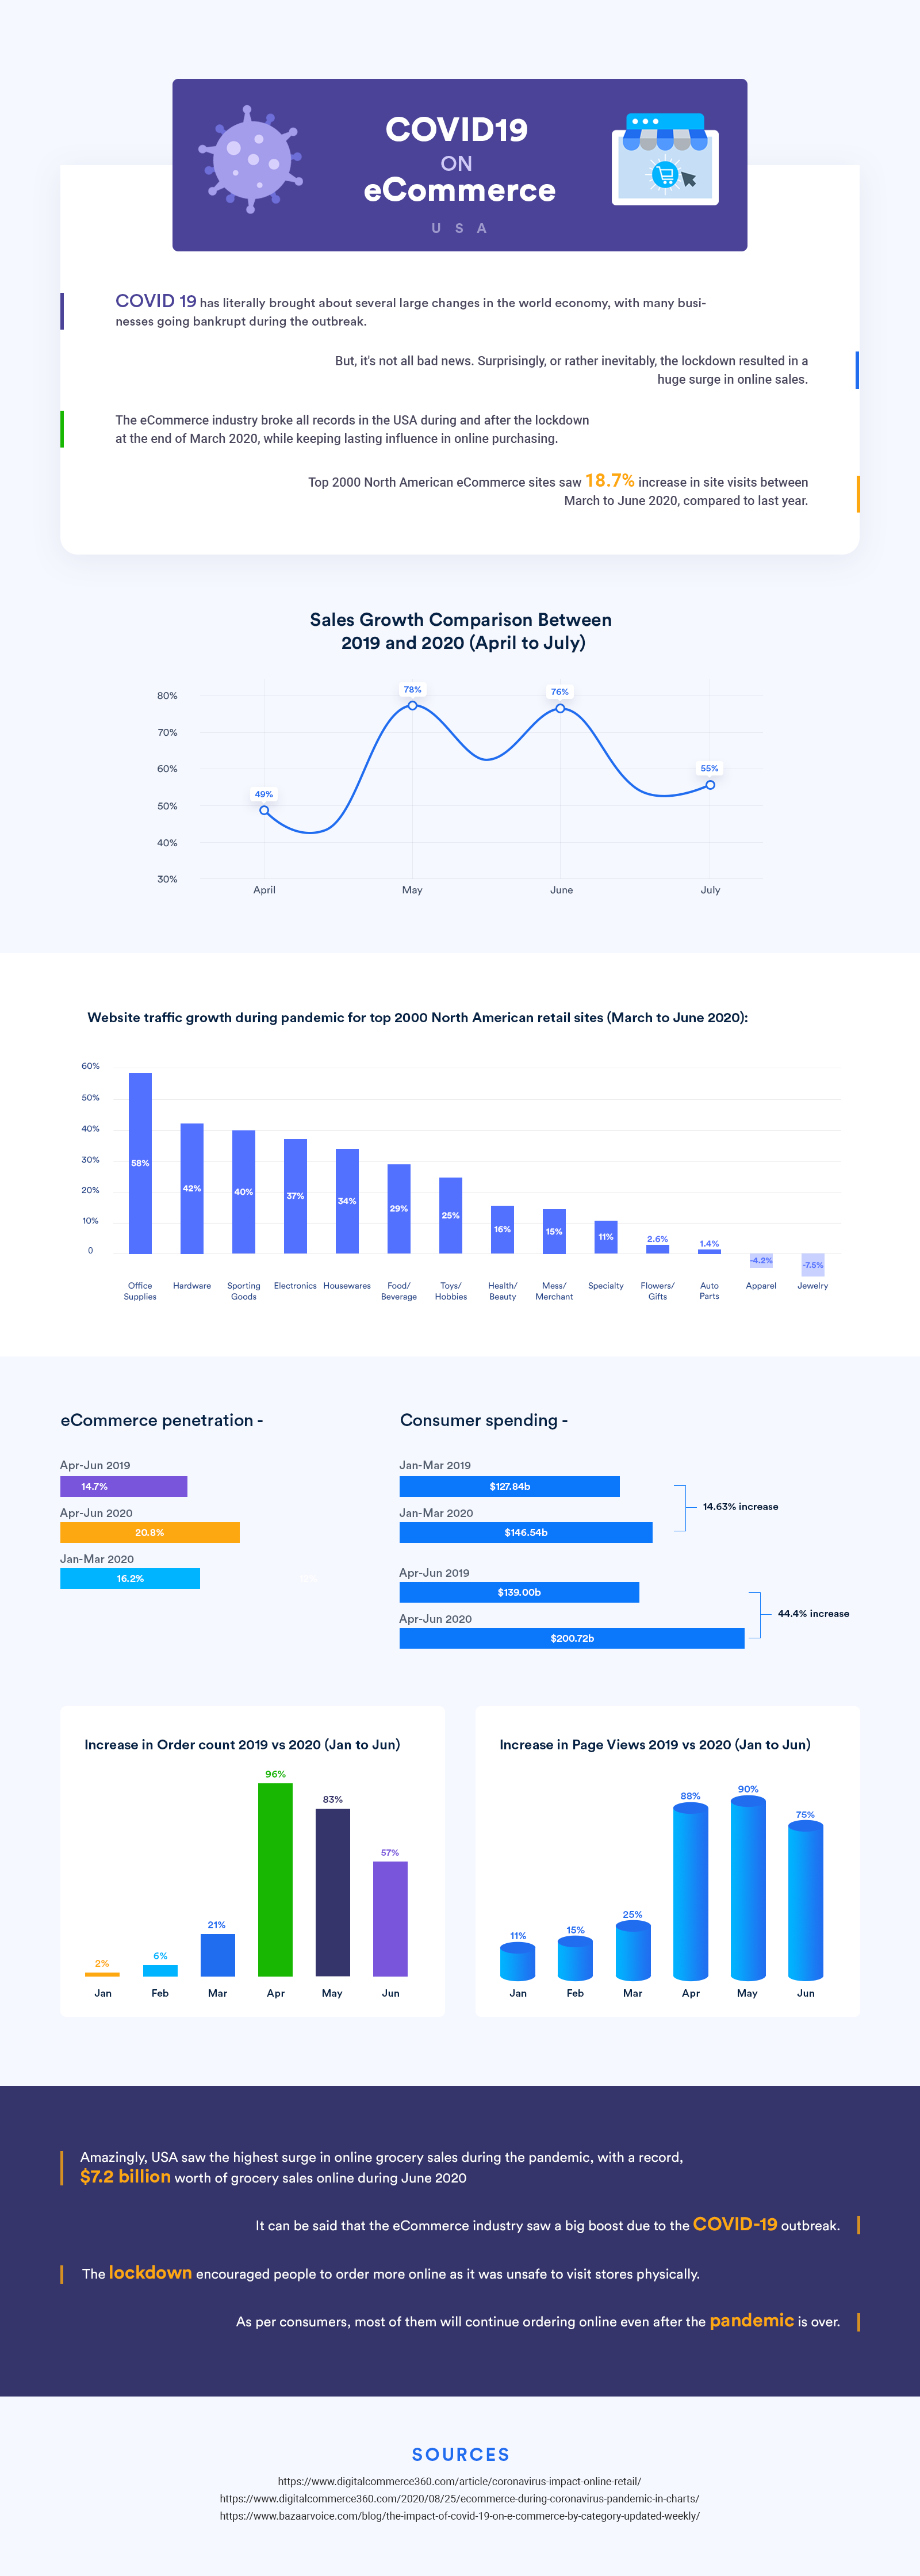
In the USA, the eCommerce industry broke all records during and after the lockdown since end of March 2020, while keeping lasting influence in online purchasing.

Here is a detailed infographic to explain how various industries prospered due to an increase in regular buyers from online stores.

COVID19 On eCommerce In The USA – Statistics & Infographic

COVID19 On eCommerce In The USA - Infographic

Key takeaways:

  • The US eCommerce industry saw an average sales growth of over 64% when comparing 2020 to 2019 during the COVID19 lockdown period (April-July).
  • Industries with essential supplies such a food supplies, grocery, office supplies, etc., saw a growth of over 40% in terms of website traffic from March to July 2020 compared to 2019.
  • Industries selling luxury items or gift items saw little to no growth in website traffic from March to July 2020, compared to 2019. Rather, some experienced a fall in website traffic. For example, the jewelry industry suffers a 7.5% fall in traffic compared to last year.
  • There was over 20.8% eCommerce penetration between April to June 2020, which is an increase of over 6% compared to the same period last year, and over 4.5% compared to the 1st quarter of 2020 (January to March 2020).
  • Consumer spending on online sales during the 2020 lockdown went up by an immense amount compared to 2019.
    • The 1st quarter of 2020, January to March, saw an increase of around 14.63% in online consumer spending compared to 2019.
    • The second quarter of 2020, April to June (which was the core lockdown period), saw a whopping increase of over 44.4% in online consumer spending compared to 2019.
  • Online shops saw an average increase of over 80% page views during the lock-down between April to June 2020, when compared to 2019.
  • An overall increase in average order count, over 78% per month, was achieved during the lockdown (April to June 2020), compared to 2019.

It can be said that the eCommerce industry saw a big boost due to the COVID19 outbreak.

The lockdown encouraged people to order more online as it was unsafe to visit stores physically.

As per consumers, most of them will continue ordering online even after the pandemic is over, which is a positive side for all online stores in the USA.

Categories
Guide

What Is Cloud Service? – Detailed Infographic [2024]

Nowadays, cloud service is way more convenient rather than using shared or dedicated hosting servers. With data centers situated all over the world, cloud services ensure your constant uptime and superfast data transfer rate with the ultimate data backup solution.

Here, you will learn why you should use cloud services and the basic structure of cloud computing.

You will be able to get some key insights into

  • how cloud services are growing over the years,
  • public cloud adoption for enterprises, and
  • basic price comparison of the top cloud storage.

Take a look at the detailed infographic.

What Is Cloud Service

Key Take-Aways:

What Is Cloud Service?

Cloud services offer you a wide range of services over the internet, including cloud-based video conferencing. These services provide you easy & affordable access to your web applications and resources from almost any device without the need for any internal infrastructure or hardware.

Why Use Cloud Service?

  • Save money
    Cloud storage offers you a pay-as-you-go service, through which you will only pay for the storage space you use, hence you can reduce your overall hosting costs significantly.
  • Increase page loading speed
    Cloud storage optimizes your site data and serves from the super-fast web server, as a result, your site will be faster than ever.
  • Backup site data
    Cloud copies your data into multiple locations and syncs your data as you make changes, hence if you accidentally delete files, or if one of the server crashes, your data will still be safe.
  • Maximum security for your sensitive data
    Cloud providers offer you native security products such as WAF, DDoS protection, etc., which provide you the maximum security for your sensitive information.

Some Interesting Facts

  • 53% of users leave a site that takes longer than three seconds to load

And you can overcome both of these issues by using a Cloud service!

Cloud Computing Structure

Cloud Deployment Types
Public
Private
Hybrid
Community
Cloud Service Models
SaaS
IaaS
PaaS
Cloud Service Providers
AWS S3
DO
GCS
Azure
  • Cloud Deployment Types
    The cloud deployment model is an infrastructure owned by a single business. It offers you a more controlled environment, through which you will have the access to the IT resources with a more centralized business model. This model can be built on external hosting or in-house.

    The cloud deployment types are:
    • Public
    • Private
    • Hybrid
    • Community
  • Cloud Service Models –
    Cloud models serve different purposes based on various businesses. Also, they can interact with each other to form one comprehensive model of cloud computing.

    Cloud models come in three types:
    • SaaS (Software as a Service),
    • IaaS (Infrastructure as a Service), and
    • PaaS (Platform as a Service).
  • Reliable Cloud Service Providers
    Among many cloud service providers, here are some of the most reliable ones:
    • Amazon S3
    • DigitalOcean
    • Google Cloud Storage
    • Microsoft Azure

More Facts About Cloud Service

Cloud Migration Service
  • This infographic is based on the following regions:
  • North America
    • US
    • Canada
  • Europe
    • United Kingdom
    • Germany
    • France
    • Rest of Europe
  • Asia Pacific (APAC)
    • China
    • Japan
    • Australia and New Zealand (ANZ)
    • Rest of APAC
  • Middle East and Africa (MEA)
    • Middle East
    • Africa
  • Latin America
    • Brazil
    • Mexico
    • Rest of Latin America

You can also create a detailed static chart with the WordPress Chart plugin.

Compound Annual Growth Rate, 2018-2022

Compound Annual Growth Rate 2018

From this Comparing Compound Annual Growth Rates (CAGRs) graph, we can see the future forecast of the rapidly growing IaaS platform. In here, it is anticipated that by the end of the year 2022, Cloud System Infrastructure Services (IaaS) growth will be more than 20%.

Cost comparison between Amazon S3, Google Cloud Storage, Microsoft Azure and DigitalOcean

AWS LightsailGoogle CloudDigitalOceanAzure
Memory21.722
CPU1 vCPU1 vCPU1 vCPU1 vCPU
Storage60 GB SSD50 GB SSD50 GB SSD50 GB SSD
Monthly Price$10/mo$26.76/mo est$10/mo$28/mo
Here’s a basic price comparison chart for AWS, GCP DO and Microsoft Azure.

Public Cloud Adoption for Enterprises

Public Cloud Adoption -Info 1

From this Public Cloud Adoption for Enterprises graph, we can see that Microsoft Azure is closing the gap with AWS, followed by Google Cloud Platform. Although DigitalOcean is far behind, it’s trying to catch up fast.

Not every company will migrate to the cloud, not yet, but the way Cloud computing is advancing, the sooner you adopt Cloud service, the better your chances of staying ahead of your competitors.

So, should you use a cloud service?

The answer is Yes.